|
The Community Collaborative Rain, Hail and Snow Network (CoCoRaHS) began on June 17, 1998. With a few observers along Colorado's Front Range, we had no idea that the network would become what it is today, with over 26,000 active observers in the United States, Canada, Puerto Rico, the U.S.Virgin Islands, the Bahamas and Guam. Please join us below for a series of messages that we will be running during the summer of 2023 as part of our 25 year Anniversary Celebration.
View the retrospective 25 year history slideshow
Jump to any section below: CoCoRaHS - Celebrating 25 Years: The Beginnings CoCoRaHS - Celebrating 25 Years: The First Five Years CoCoRaHS - Celebrating 25 Years: CoCoRaHS Spreads Across the United States CoCoRaHS - Celebrating 25 Years: The Accidental Network CoCoRaHS - Celebrating 25 Years: The Past Five Years CoCoRaHS - Celebrating 25 Years: 25 Years of Precipitation Data CoCoRaHS - Celebrating 25 Years: What's Next? CoCoRaHS - Celebrating 25 Years: The beginnings During the summer of 1997, the Colorado Climate Center initiated a small project to test the feasibility of equipping volunteers with foil-covered Styrofoam pads to improve data resources related to Colorado hailstorms. A high school student quipped “By the time it hails, we will have forgotten what you asked us to do. Wouldn’t it be better to have volunteers involved in something that can give them something to do more often?” Then on the afternoon of July 27, 1997, it began to rain along the west side of Fort Collins, Colorado. The following day the rain intensity grew, mostly on the west edge of the city. Just five miles to the east only a light rain fell. As the afternoon turned to night, the west side of town was engulfed in a deluge that did not let up. Spring Creek, usually a small stream barely four feet wide, became a raging torrent overflowing its banks as it flowed eastward following its natural path to lower elevation. More than 13 inches of rain, almost the annual average of precipitation for the Fort Collins area, fell from this storm on the west side of town, resulting in a devastating flash flood that claimed five lives that night. No one reported the heavy rain to the National Weather Service office. The opportunity to provide early warning of this flood was missed. Fast forward to Spring of 1998. Thanks to a small grant from the Colorado Office of Emergency Management, and help from Fort Collins water and storm water utilities, a project was envisioned to engage students and families from across Fort Collins in measuring and reporting precipitation from summer storms. The name “Colorado Collaborative Rain and Hail Study” (CoCoRaHS) was coined. Three high school students were enlisted to help, each with different skills and talents. Daphne, from Poudre High School, oversaw volunteer recruiting and training. She successfully found at least one family from every school in the district to help, 40 at the time. Luke, from Fort Collins High School, was interested in web development and got to work designing webpages for volunteers to access to enter their daily rainfall reports. Tom, from Rocky Mountain High School, was the big thinker of the group and envisioned a way to store, display and map all the data each day so volunteers could quickly see how their rainfall measurement compared to others in and near Fort Collins. The team didn’t get much of their regular schoolwork done that spring, but they worked feverishly on CoCoRaHS. Then serendipity showed up in the form of a public service announcement. It aired on a local “oldies” radio station, playing music from the 1940s and 1950s. Many retirees responded by volunteering to help measure rain and hail. As summer approached, the building blocks for CoCoRaHS were in place.
Nolan, and the team of students, held a series of public seminars and a rain and hail measurement training session. The community responded enthusiastically. On June 17th, 1998, the students flipped the switch and turned on the first version of the CoCoRaHS website – and it worked!!! Several dozen reports were successfully submitted and mapped. CoCoRaHS was born. (Watch the video)
CoCoRaHS - Celebrating 25 Years: The First Five Years The first five years of CoCoRaHS were exciting, but chaotic, as the project gradually gained momentum. Financial and personnel resources were few, but energy and commitment from our volunteers was exceptionally high and motivational. Our high school students that got the project started all graduated and moved on. Fortunately, one of our adult volunteers with computer programming experience stepped forward to help maintain the website. Other volunteers helped manage phone calls and other essential duties.
The first winter set the tone. Our initial intent was to stand down the project for the winter months and start again in Spring 1999. However, many volunteers protested. They wanted to measure and report snow, too. After some consideration, we decided to give it a try. We organized several well-attended training sessions on how to measure and report snow. Growth and expansion began slowly in the nearby communities of Loveland and Greeley. A stormy week and a regional flood in late April 1999 clearly showed the value of a detailed local rain gauge network. Data credibility grew.
In an effort to thank and motivate volunteers, we began organizing educational opportunities such as evening seminars and weekend field trips. Kids, families, and seniors all participated with keen interest. We partnered with a research radar facility nearby that was exploring remote sensing of hail. We began doing “hail pad parties” as a way of involving volunteers in project logistics.
While attending a meteorological conference out of state, Nolan stumbled upon a flyer lying on a table. This flyer described a new program on geoscience education at the National Science Foundation. It seemed perfect for CoCoRaHS. Within a few months, we wrote a proposal that was promptly funded – linking CoCoRaHS to a major thunderstorm research project scheduled for the summer of 2000. We were presented with a unique opportunity to support the research mission of the Severe Thunderstorm Electrification and Precipitation Study (STEPS). This NSF funding supported hiring several high school and college students to help with volunteer recruiting, training, and data collection. We helped organize public events to meet project scientists, and we held a field trip to Goodland, Kansas to see the research aircraft and National Weather Service office there.
After so much enthusiasm and growth in 1999 and 2000, weather patterns changed. Storms gave way to drought. Recruiting volunteers got harder and harder. A common response to our invitation to join CoCoRaHS was “Who needs a rain gauge. All I’d ever measure is dust.” But as the extreme drought of 2002 unfolded, some volunteers became active spokespeople for local drought awareness and community water conservation. A broader interest in CoCoRaHS developed leading to sponsorship from several Colorado water utilities. Partnerships developed almost spontaneously with Extension Offices, USDA County Service Centers and Conservation Districts leading to dramatic growth particularly in rural Colorado.
By 2003, CoCoRaHS had expanded to much of Colorado, and just in a nick of time. While facing prospects of multiyear extreme drought that March, a storm system took shape over the West headed towards Colorado. Copious moisture from the Gulf of Mexico streamed northwestward towards Colorado feeding into the storm. Thanks to excellent weather forecasts, and the ability to contact volunteers efficiently by email, warnings of several feet of wet snow were communicated along with instructions on how to measure huge snow. The storm materialized, and exceptional snowfall and water content data were collected that were immediately valuable in storm documentation, engineering applications (many roofs collapsed), and research.
In just five years, CoCoRaHS grew from a local experiment to a year-round source of reliable Colorado statewide data. The partnerships that had been forged were also aiding the overall outreach and climate monitoring mission of the Colorado Climate Center. Other states were taking notice.
CoCoRaHS - Celebrating 25 Years: CoCoRaHS spreads across the United States
From the very beginning of CoCoRaHS in Year 1998, the radar meteorology research group in the Department of Atmospheric Science at Colorado State University had watched with interest. Data collected by volunteers with plastic rain gauges and foil-wrapped Styrofoam pads repeatedly proved useful in the research efforts of the CSU CHILL Radar team. To help CoCoRaHS, one of their scientists, Rob Cifelli, helped draft a proposal to the National Science Foundation (NSF) to expand CoCoRaHS from Colorado into portions of Kansas, Nebraska, and Wyoming. Much to our surprise and amazement, the proposal was funded in 2003, providing support to hire a small staff, a project coordinator, and a Web developer. Within a year, a new and greatly advanced website was up and running and volunteers were signing up in our neighboring states. National Weather Service offices and State Climatologists from these adjacent states were immediately eager to get involved. Nebraska took special ownership in the idea and invited Nolan Doesken to speak to the Nebraska Natural Resource Districts and provide detailed training in precipitation measurement procedures. Soon after, the Nebraska Rainfall Analysis Information Network was launched, affectionately named NeRAIN (pronounced “Any Rain”). The number of active volunteers quickly grew from a few hundred in 2003 to over 2,000 by the summer of 2004.
The new website provided nearly instantaneous access to state and county maps of precipitation data allowing both participants and other internet users to view and access local precipitation data for every day of the year. An impressive “Administrative” portal helped volunteer leaders to efficiently assign station names and numbers to each new volunteer and track and communicate with these participants. In September 2004, a new CoCoRaHS national coordinator was hired. That was Henry Reges, a meteorologist with the American Meteorological Society with a business management background, and with many professional connections. During the first month on the job, he began building a national vision for the project. This included the revised name “Community Collaborative Rain, Hail and Snow” network and a sharp new logo. Julian Turner, who served both as web developer and volunteer support leader, refined the website and added creative artistic touches. More training materials were also added making the website a hub both for volunteer data collectors but also for a growing number of users interested in precipitation. As CoCoRaHS matured into a professional-looking young organization, other states took interest and began asking to join. New Mexico rolled out CoCoRaHS in 2005 with great success. At about this same time, Chad Gimmestad, a local meteorologist with the National Weather Service in Boulder, Colorado developed a capability for CoCoRaHS hail and heavy rain reports to be almost instantly communicated to National Weather Service office workstations where they alerted local forecasters. This new feature added a new operational value to the CoCoRaHS network – helping provide early documentation of severe and hazardous weather. Educational activities grew in importance. Working with meteorologists from National Weather Service offices in Goodland, Kansas and Cheyenne, Wyoming, the CoCoRaHS team lead all-day workshops for teachers from rural schools and conducted more field trips and learning opportunities for volunteers. In 2006, CoCoRaHS was the recipient of an important “environmental literacy” grant from NOAA’s Office of Education. This grant specifically funded expansion of the CoCoRaHS program nationally utilizing and leveraging partnerships with State Climatologists, National Weather Service offices, universities, and other interested groups. Using a thoughtful strategy of first building state-based local leadership teams, CoCoRaHS began a slow, but methodical expansion across the country from 2006 through 2009. Newspaper articles, TV news features, e-mail listserves, word of mouth and National Weather Service website announcements helped spread the network to all fifty states and the District of Columbia. The last state to join was Minnesota in 2009. Not only were our observers learning about the environment and rainfall patterns, but they were providing the nation with a daily pool of valuable rainfall data. By 2009, the number of active volunteers grew to over 12,000 making CoCoRaHS the largest source of daily rainfall measurements in the country.
CoCoRaHS - Celebrating 25 Years: The Accidental Network State by state, CoCoRaHS grew to cover all states and most counties. Then the winter of 2010-2011 came along leaving a deep and widespread cover of snow and ice across the upper Missouri River Basin and parts of the southern Canadian prairies. As this snow melted in spring, torrents of flood waters inundated extensive areas of North Dakota, eastern Montana, and the entire flood plain of the Missouri River downstream all the way to St. Louis, Missouri. Our Canadian neighbors also suffered weeks of hardship as flood waters from the Prairies made their way to Lake Manitoba and Lake Winnipeg. Lack of adequate data was blamed for some of the difficulties in predicting the magnitude, extent, and timing of the flooding. The Canadian Wheat Board, along with the Province of Manitoba, reached out to CoCoRaHS and within a few months “CoCoRaHS Canada” was born. This Provincial effort quickly grew and now all parts of Canada can participate. This expansion required the addition of metric units and a French-language version of the website and some training materials. With the help of NOAA, Puerto Rico (2014) and the U.S. Virgin Islands (2015) joined the network next. In 2016, the World Meteorological Organization (WMO) in collaboration with NOAA, helped sponsor a CoCoRaHS pilot project in the Bahamas. Both Canada and the Islands of the Bahamas have taken well to CoCoRaHS and trust and use the data extensively. In collaboration with the National Drought Mitigation Center (NDMC), the National Integrated Drought Information System (NIDIS) and the Carolinas Integrated Sciences and Assessments (CISA) team, Condition Monitoring was introduced in 2016 and continues to give observers the chance to report what their landscape's condition (wet, normal, dry) is during any given week. Recently a mapping system was deployed to show these reports in context with the U.S. Drought Monitor weekly map. Information has proven invaluable to those who look at drought across the country. This type of information is now being extended to Canada as well.
CoCoRaHS - Celebrating 25 Years: The Past Five Years (2018-2023) From 2018 to 2023, CoCoRaHS saw continued growth and more changes. The coronavirus pandemic, that started in 2020, showed that CoCoRaHS was the perfect stay-at-home activity. March and April 2020 proved to be one of our best months yet and our entire network saw over 5,700 new signups during 2020. Social distancing was important during the coronavirus pandemic, and our observer from Crested Butte CO, billy barr (CO-GN-18) became a celebrity and an incredible recruiter for our network with his “Tips from someone with 50 years of social distancing” CoCoRaHS was something many of us did, just to keep track of something. While we stayed close to home during 2020, the same applied to members of our CoCoRaHS Headquarters staff. After hours of online meetings, while none of us were able to travel, we finally put the finishing touches on years of development and testing and rolled out our new interactive map. maps.cocorahs.org The new map has been a wonderful gift to us and to our user community. For the first time, we can combine daily reports with multi-day reports and display those totals on this map, which contributes to drought monitoring as well as tropical cyclone storm totals. 2021 saw another significant change with CoCoRaHS. Since 2010, Water Year Summaries were generated each year by state, once in October and again in November. This process was very computer intensive and only captured data at those points in time. With the change we have made, Water Year Summaries are now dynamic, updated with each report that is made. Look at wys.cocorahs.org. CoCoRaHS continues to expand. At the request of the National Weather Service, the Pacific Island of Guam was added to our network in September 2022. This addition proved to be different than adding any of our previous states and countries. Guam is the very first location we have added in the Eastern Hemisphere, so all our latitude and longitude figures, as well as time zone adjustments for local reports, had to be made to accommodate this far away island. The American Meteorological Society (AMS) met in Denver, Colorado during January 2023. CoCoRaHS was given the chance to feature itself and its contributions to science. Several fifteen minute sessions were made, highlighting the impacts CoCoRaHS has made during its 25 years. The ”H” is CoCoRaHS got a small shot in the arm. In 2023, CoCoRaHS allowed uploads of photos to Hail Reports. And many of you may have noticed as you read both academic and general literature, CoCoRaHS continues to appear in many publications.
CoCoRaHS - Celebrating 25 Years: 25 Years of Data (narrative by CoCoRaHS founder, Nolan Doesken, and graphics and analysis credit to Matt Spies) As of our anniversary date – June 17, 2023, CoCoRaHS volunteers have contributed 67,422,501 daily rainfall reports. This deserves a celebration!! 41,652,393 of those entries were zero (~ 62 %). This fraction varies seasonally and geographically. For example, In Arizona in June of this year, 98% of their daily reports were Zero (0.00”) while in the opposite corner of the country, Maine observers reported only 25% Zeroes – yes, they were having a remarkably wet early summer. Our participants in Canada ranged from 31% zeroes in New Brunswick to 45% zeroes in Newfoundland/Labrador. And in Guam (our newest addition to the network) observers reported zero only 11% of the time in June 2023 with only 22 zeros out of 204 daily reports – obviously not their dry season 😊.
In addition, we have received 47,920 hail reports, since our network's beginning when we were called the "Colorado Collaborative Rain and Hail Study". That may sound small by comparison, but in terms of information content, it is extraordinary since CoCoRaHS hail reports contain so much precious detail about stone size, color, hardness, duration, time of day, type of damage, etc. etc.
Do we learn anything from all these data. Goodness gracious do we ever!! There is no end to what we can learn together. Let’s start with variability. Just within the City limits here in Fort Collins where we are blessed with many data points, it is more common to see precipitation totals vary by a factor of ten across the area than to see relative consistency across town. Here is our local map for July 21, 2023 for example.
Variability is greatest during the summer when thunderstorms are the primary source of precipitation for much of our territory. But even during the late fall and winter, when broad areas receive precipitation at the same time, local variability is often substantial. One of the most common things we hear our volunteers say after they’ve been with us just a few months is “I never knew rainfall varied so much”. Take a look at any one of our daily precipitation maps and zoom into your favorite area. It won’t take long to find plenty of good examples.
CoCoRaHS makes it very easy for us to look at rainfall extremes. I still enjoy using the old classic "Static Map" where the color scale always shows the single heaviest rainfall amount as the darkest red color. Yesterday (July 19) it was extreme southern Illinois and western KY. Last weekend it was Long Island and Rhode Island. A few days earlier it was Vermont, New York and Connecticut.
Every day precipitation information is summarized in my favorite CoCoRaHS summary – our Rainy Days report. Here is an example of the information contained in this report and then graphed beginning in 2010 when all 50 states were participating for the first time. What it is showing is the largest rainfall total observed each day for the past 13 ½ years (nearly 5000 days) from the total observing network including Canada, Bahamas, Puerto Rico, Guam, etc.
It is a noisy graph but if you look closely, you see there is a consistent annual cycle as heavier rains tend to fall during the summer and autumn months. It also shows the occasional truly extreme rainfall amounts including the remarkable observation of 36.49” observed by a diligent observer on the Island of Kauai on April 15, 2018. 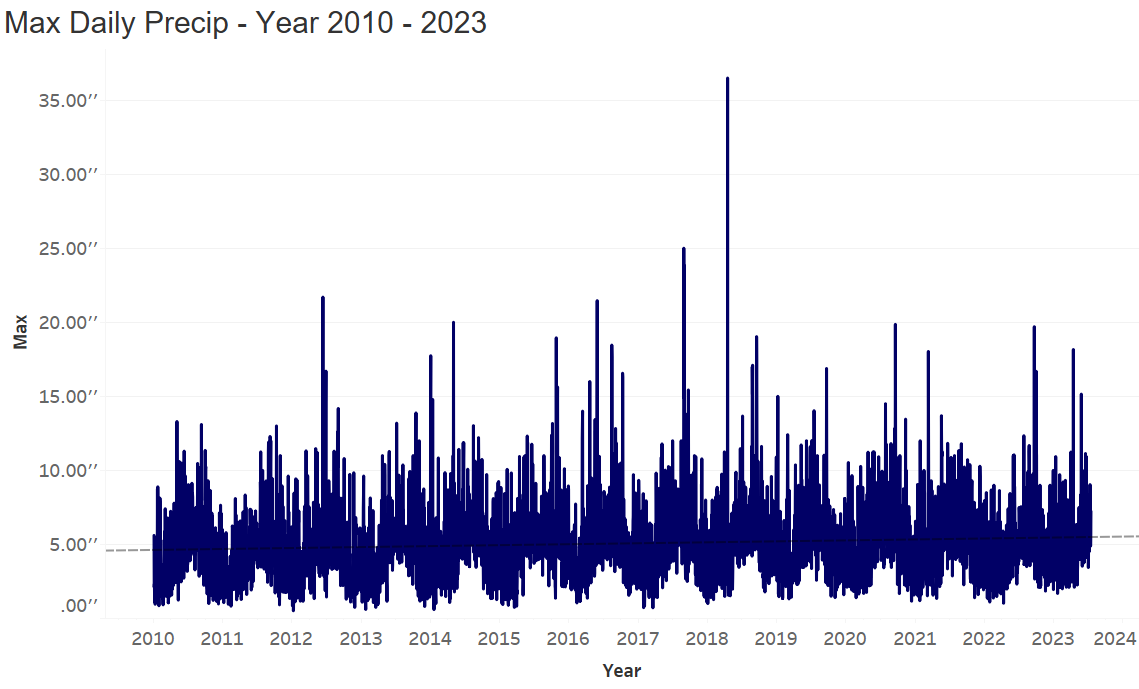
An amazing achievement of CoCoRaHS is our growth. These graphs below show both the growth of numbers in daily reports but also the growth in active participants. 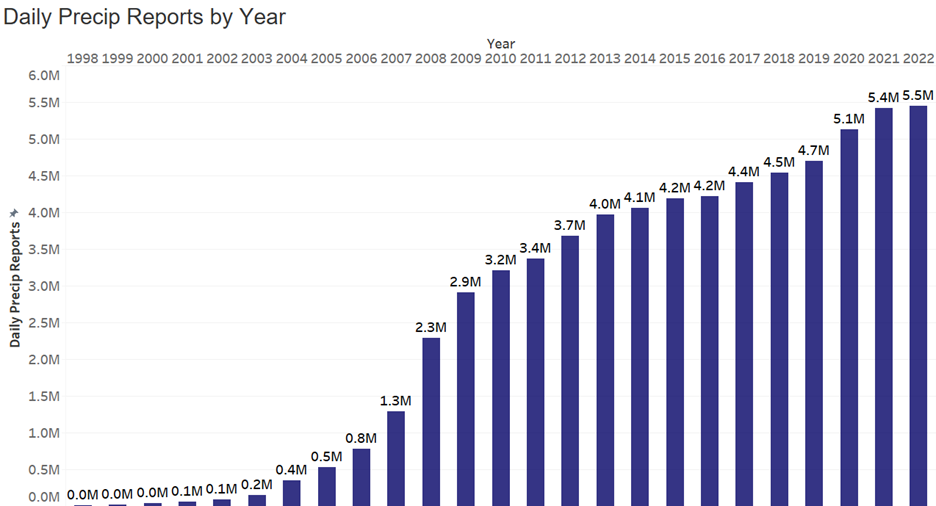
We look over a span of the previous 12 months, when counting Reporting Observers. 25,245 observers submitted a report during Year 2022. Now just halfway through Year 2023 we have already added nearly 1,100 to this active station list. 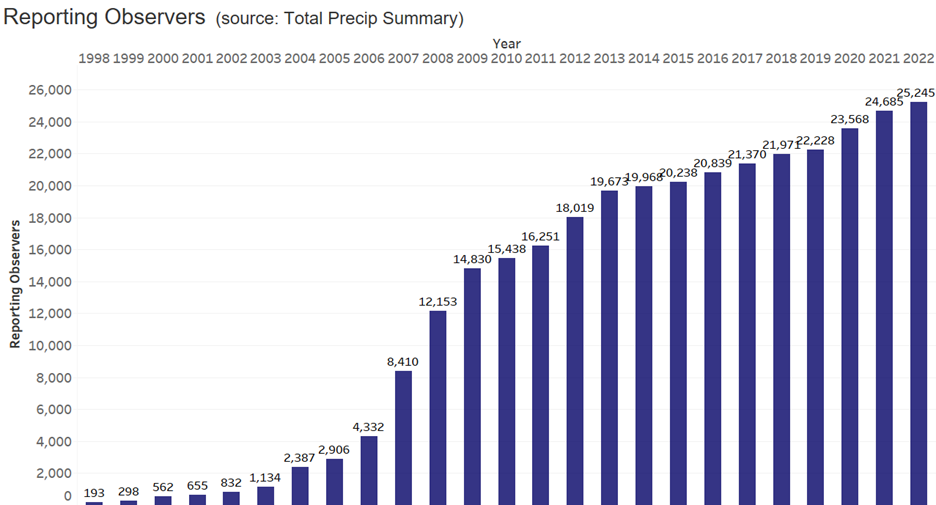
We love seeing new people join CoCoRaHS, but we are aware of two realities with our network. The first reality is that not everyone that joins gets involved and submits even just one report. For every 3 people that signup, about 2 of those 3 will submit a report, a 68% onboarding rate. What happens to the other 32%?? 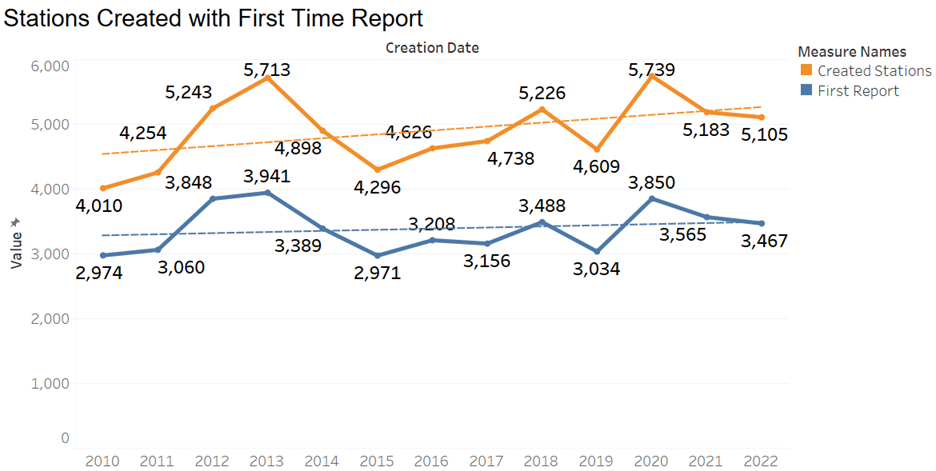
Year 2023 is turning out to be another up year as well. It may surpass what we saw in Year 2020 when COVID created an enthusiasm to “observe something close to home and be useful somehow”. But why now? Don’t know, but we like it.
The second reality is that people stop reporting for various reasons. As our network grows in numbers, we can expect a growing number to stop reporting, as the chart below shows in a red line. 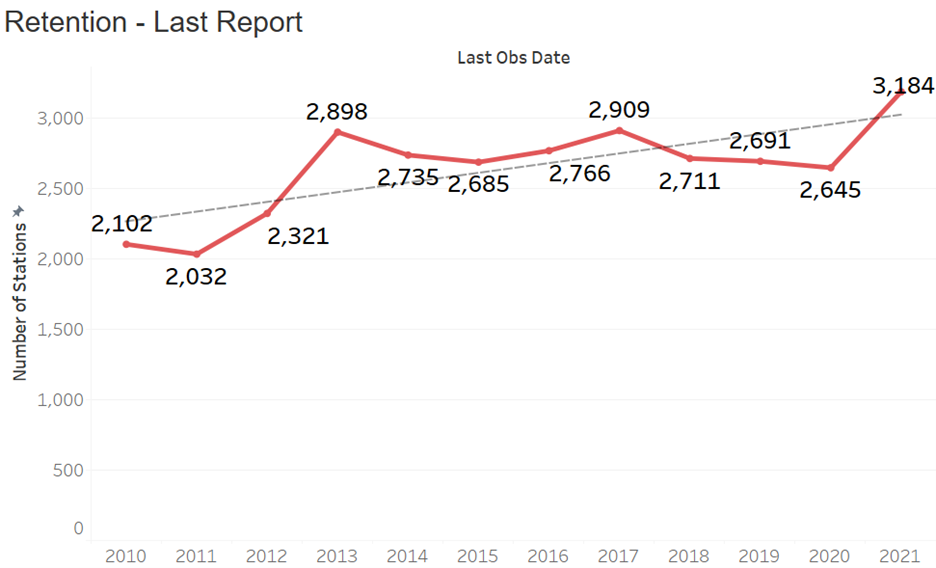
As we have slightly more than 3,000 that start reporting in a Year, we are fortunate that slightly less than 3,000 stop reporting in a Year. This aspect helps sustain our growth. As I approach my 9000th daily precip report for CoCoRaHS, I do not stand alone, but we long-timers are in the minority. 😊 The graph below shows our active observers, broken up by the count of their daily observations. A rule of thumb is that roughly half of all of our active observers have submitted 1,000 or more reports (equivalent to about three years of complete data). The other half are relative newbies with less than 1,000 daily reports. 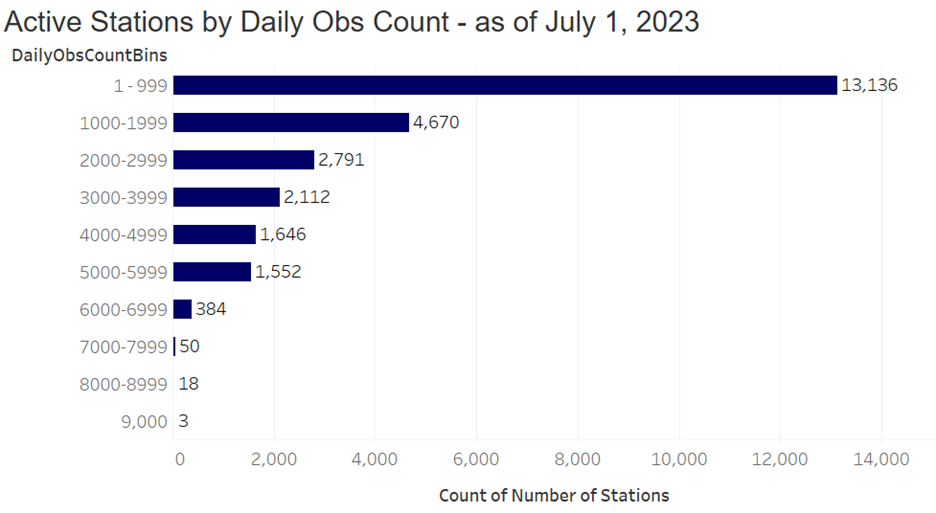
I could go on and on. I am hooked on our data, for sure, and I hope you are too. We could easily write a book or two on what we are learning from our 25 years of data, so keep the data coming!!
CoCoRaHS - Celebrating 25 Years: What’s Next? Nolan Doesken’s personal thoughts on the future of CoCoRaHS. As CoCoRaHS was taking its roots, the common denominator between meteorologists, climatologists, ag experts, water resource experts and many more as well as the general public was the simple (relatively) measurement of precipitation. And we were constantly amazed at all of the wonderful partnerships and personal friendships that formed along the way. Let’s keep this alive and pass it on to the next generation. What do I want this project to look like and feel like?
My answers apply both now and years in the future. I want participating in CoCoRaHS to be fun, not forced. Pleasure, not work. I hope we can continue our focus on learning through participation -- learning from the data that we collect, posing questions, and deriving answers from our own data. So far, CoCoRaHS has been able to maintain the experienced staff available and committed to personally answering questions from our volunteers – usually within 24 hours. This will be difficult as we continue to grow, and it may require greater use of technology and through distributed leadership. But I want us to try very hard to maintain this. In an ideal world, the cost of a rain gauge wouldn’t be an issue, that if someone needed a gauge, one could be provided to them. We find that people often quit reporting when their rain gauge needs to be replaced. As I make more and more clumsy errors when entering my data, I have realized why many do not enter comments. Any ability that technology gives to enter our data swiftly and accurately, I’m all for taking advantage of it. Even as we started 25 years ago, we wanted to be able to get sub-daily reporting, and Significant Weather Reports was designed. Going forward, finer time resolution data will be ever more critical to the needs of many. An appropriate mix of automated digital data collection along with our accurate and consistent daily data provided by our volunteers will make this possible. CoCoRaHS is inherently a weather project. But the longer we keep going the more we contribute to defining our climate – its variations and extremes. Will there be a need for precipitation data?
Yes. Precipitation remains the most variable element of our weather, necessitating a dense network of observations. Weather information is becoming increasingly important in the context of climate change -- and data, together with ever-more sophisticated analysis and prediction techniques -- are driving more and more decisions in agriculture, water resource management, flood prediction and control, transportation, utilities, and many other parts of society. So, it is difficult to imagine that manual, on-the-ground precipitation measurements will not still be needed 25 years from now. Will CoCoRaHS continue to grow?
Yes. We continue to have potential for growth, both within and outside of the United States. Our largest numbers of new recruits tend to be recent retirees. With Baby Boomers retiring in droves, there will continue to be a large pool to draw from over the next few years. We will also need a pool of younger volunteers, so please keep up with recruiting your family members. Also, over the past 12 years, CoCoRaHS has expanded beyond the borders of the 50 U.S. states to Canada, Puerto Rico, the U.S. Virgin Islands, the Bahamas, and Guam. Which U.S. Territories and countries will be next? Will we be able to fill in the gaps?
Our area is so large and so sparsely populated that we will likely never fill all gaps with volunteer observations. However, who knows what technological advances may make possible in the future. Will we continue to use manual rain gauges?
Yes. Automated gauges are not reliable for the long term, at least so far. However, perhaps some additional steps in the observing process will become more automated. For example, perhaps we are not that far away from being able to hold our smart phone camera up to the gauge and have it “read” the amount of precipitation in the gauge. It might then ask some additional questions before proceeding to enter it into the CoCoRaHS entry form and displaying it for the observer to confirm. The gauge might still need to be emptied, and occasionally cleaned, manually. Will we still be using the same gauge as today?
Many aspects of the gauge will still be the same, but it is unlikely that we will still be using the exact same traditional 4-inch CoCoRaHS gauge in 2048. We are already finding that we need larger gauges to be able to capture amounts exceeding 11 inches. I expect that well before then, we will be able to computer generate our own gauges to desired specifications – probably built from recycled or biologically-grown materials. Will our website still be the same?
Well, with communication and data handling technology changing as rapidly as it is, the first question to consider is whether there will still be websites. Or will everything be done within apps or via a method not yet conceived? Will there be an AI-enhanced chatbot standing by to answer questions from CoCoRaHS users and observers. such as, “What does the “T” in the data tables stand for?” or “I saw it raining, but there is nothing in my gauge. What should I report? Will our web developer, our youngest staff member when he joined us in 2003, still be here in 2048?” Finally, some final thoughts and musings
I want participating in CoCoRaHS to be fun, not forced; pleasure, not work; exciting, not boring and inherently educational. I hope we can continue our focus on learning through participation -- learning from the data that we collect, posing questions, and deriving answers from our own data. Hopefully we can all learn more geography along the way, too. So far, CoCoRaHS has been able to maintain the experienced staff available and committed to personally answering questions from our volunteers – usually within 24 hours. This will be difficult as we continue to grow, and it may require greater use of technology and through distributed leadership. But I want us to try very hard to maintain this sense of individual value and importance even in a techie world. In an ideal world, the cost of a rain gauge wouldn’t be an issue, that if someone needed a gauge, one could be provided to them. We find that people often quit reporting when their rain gauge needs to be replaced. This is a bigger challenge than most of us realize just because of the size and scale of our network. As I make more and more clumsy errors when entering my data, I have realized why many of us do not enter comments. Any ability that technology gives to enter our data swiftly and accurately, I’m all for taking advantage of it. Going forward, finer time resolution data will be ever more critical to the needs of most decision makers. Our “Significant Weather Reports” help in that regard but will need to advance further. An appropriate mix of automated digital data collection along with our accurate and consistent daily data provided by our volunteers will make this possible. CoCoRaHS is inherently a weather project. But the longer we keep going the more we contribute to defining our climate – its patterns, variations, and extremes. And closing with a word of thanks
Thanks to all of you who have gone on this journey with me. While we may not know what exactly is around the next bend, our curiosity alone should keep us moving ahead.
- Nolan Doesken, CoCoRaHS Founder
|