|
THE ANNUAL COCORAHS RAIN GAUGE RALLY 2026 FINAL RESULTS!!MINNESOTA (377) WINS THE TRADITIONAL CATEGORY FOR THE SEVENTH YEAR IN A ROW
WYOMING (70) WINS THE PER CAPITA CATEGORY FOR THE SECOND YEAR IN A ROW!
1,544 NEW OBSERVERS HAVE JOINED THE NETWORK DURING APRIL!
Total Station Count: 1,543
|
Minnesota
| 377 |
1
| 65.94 |
2
| 5.72 |
|
Virginia
| 87 |
2
| 10.02 |
8
| 8.68 |
|
Texas
| 85 |
3
| 2.83 |
29
| 30.03 |
|
Wisconsin
| 81 |
4
| 13.75 |
6
| 5.89 |
|
Wyoming
| 70 |
5
| 120.40 |
1
| 0.58 |
|
Ohio
| 57 |
6
| 4.85 |
18
| 11.76 |
|
Alabama
| 53 |
7
| 10.44 |
7
| 5.07 |
|
North Carolina
| 51 |
8
| 4.77 |
19
| 10.70 |
|
Indiana
| 49 |
9
| 7.17 |
12
| 6.83 |
|
Colorado
| 46 |
10
| 7.88 |
9
| 5.84 |
|
Michigan
| 46 |
10
| 4.58 |
21
| 10.03 |
|
New York
| 45 |
12
| 2.29 |
32
| 19.68 |
|
Illinois
| 42 |
13
| 3.34 |
27
| 12.58 |
|
Tennessee
| 39 |
14
| 5.53 |
15
| 7.05 |
|
Nebraska
| 31 |
15
| 15.75 |
5
| 1.97 |
|
Vermont
| 30 |
16
| 46.36 |
3
| 0.65 |
|
Florida
| 28 |
17
| 1.26 |
40
| 22.24 |
|
Kentucky
| 26 |
18
| 5.76 |
14
| 4.51 |
|
South Carolina
| 26 |
18
| 4.92 |
17
| 5.28 |
|
Oklahoma
| 24 |
20
| 5.97 |
13
| 4.02 |
|
Pennsylvania
| 23 |
21
| 1.77 |
36
| 12.97 |
|
Missouri
| 17 |
22
| 2.75 |
31
| 6.18 |
|
Georgia
| 16 |
23
| 1.47 |
38
| 10.91 |
|
Massachusetts
| 15 |
24
| 2.15 |
33
| 6.98 |
|
Kansas
| 15 |
24
| 5.11 |
16
| 2.94 |
|
South Dakota
| 15 |
24
| 16.49 |
4
| 0.91 |
|
Mississippi
| 14 |
27
| 4.76 |
20
| 2.94 |
|
Iowa
| 14 |
27
| 4.37 |
22
| 3.20 |
|
California
| 13 |
29
| 0.33 |
47
| 39.03 |
|
Arkansas
| 11 |
30
| 3.61 |
26
| 3.05 |
|
Connecticut
| 10 |
31
| 2.76 |
30
| 3.63 |
|
Maine
| 10 |
31
| 7.22 |
11
| 1.39 |
|
New Mexico
| 8 |
33
| 3.79 |
25
| 2.11 |
|
New Jersey
| 8 |
33
| 0.86 |
44
| 9.26 |
|
Washington
| 8 |
33
| 1.03 |
41
| 7.79 |
|
West Virginia
| 7 |
36
| 3.94 |
24
| 1.78 |
|
Utah
| 7 |
36
| 2.07 |
34
| 3.38 |
|
North Dakota
| 6 |
38
| 7.70 |
10
| 0.78 |
|
Canada
| 6 |
38
| 0.15 |
49
| 39.29 |
|
Oregon
| 4 |
40
| 0.94 |
42
| 4.24 |
|
New Hampshire
| 4 |
40
| 2.87 |
28
| 1.40 |
|
Alaska
| 3 |
42
| 4.09 |
23
| 0.73 |
|
Idaho
| 3 |
42
| 1.55 |
37
| 1.94 |
|
Louisiana
| 3 |
42
| 0.65 |
45
| 4.59 |
|
Maryland
| 3 |
42
| 0.49 |
46
| 6.16 |
|
Hawaii
| 2 |
46
| 1.39 |
39
| 1.44 |
|
Montana
| 2 |
46
| 1.78 |
35
| 1.12 |
|
Rhode Island
| 1 |
48
| 0.91 |
43
| 1.09 |
|
Arizona
| 1 |
48
| 0.14 |
50
| 7.36 |
|
Nevada
| 1 |
48
| 0.31 |
48
| 3.18 |
|
Delaware
| 0 |
51
| 0.00 |
51
| 1.02 |
|
District of Columbia
| 0 |
51
| 0.00 |
51
| 0.67 |
|
Bahamas
| 0 |
51
| 0.00 |
51
| 0.41 |
|
Guam
| 0 |
51
| 0.00 |
51
| 0.17 |
|
Northern Mariana Islands
| 0 |
51
| 0.00 |
51
| 0.05 |
|
Puerto Rico
| 0 |
51
| 0.00 |
51
| 3.22 |
|
Virgin Islands
| 0 |
51
| 0.00 |
51
| 0.10 |

View the "CoCoRaHS Rain Gauge Rally 2026" trailer
THE ANNUAL COCORAHS RAIN GAUGE RALLY
Welcome to the CoCoRaHS Rain Gauge Rally Page. This year, the contest moves to April for the first time. The CoCoRaHS Rain Gauge Rally is our friendly recruiting contest to see who can recruit the most new volunteers during the 30 days of April. There is always a need for more observations, as the saying goes: "the rain doesn't fall the same on all." Due to precipitation variability, amounts measured can vary significantly, even within a block or two. Help fill in the gaps by recruiting a friend or relative during our contest. The more observations, the clearer the picture, the better the understanding of where it did and did not rain.
..
The contest is broken down into two categories: "Traditional Count"... the state/country/commonwealth that recruits the greatest number of new observers in April. The second category is "Per Capita*" or population weighted... the state/country/commonwealth that recruits the greatest number of new observers per one million of its total population.
The winning state/country/commonwealth in each category receives the "CoCoRaHS Cup" to keep and exhibit for a year until next year's contest (in the tradition of the NHL's Stanley Cup). The cup usually travels around the state/country/commonwealth during the year, so check with your state/country/commonwealth coordinator for its whereabouts at any time.
HISTORY
View the past cup winners (2006-2025) 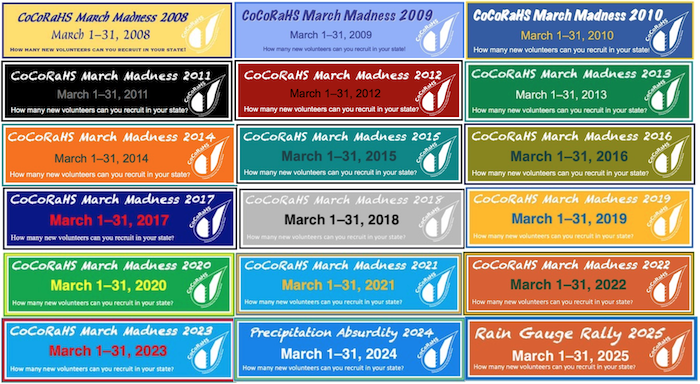
VIEWING THE COCORAHS CUP
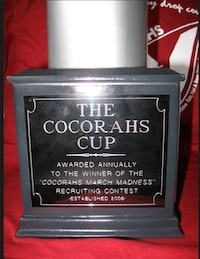 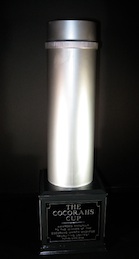 
  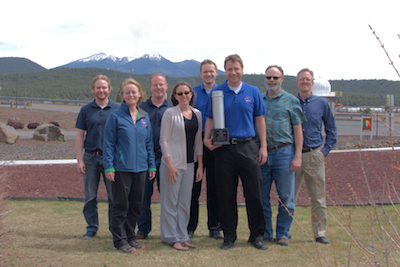 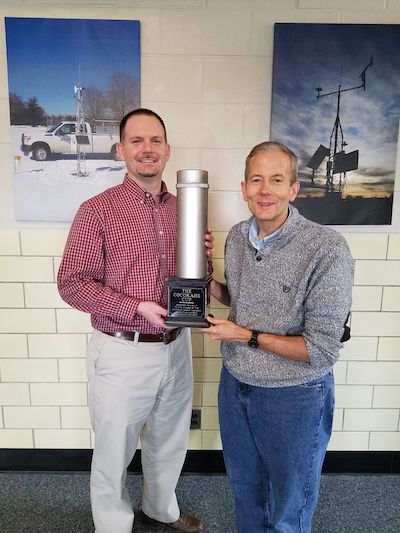  
The CoCoRaHS Cup - Does it look like a sterling silver rain gauge? Tiffany's would be proud.
*Per Capita Scoring - For each new volunteer who signs up, the state/country/commonwealth will be given a percentage of "one point" based on their total population (potential volunteer pool). This will give those with sparser populations an equal chance. Those with smaller populations will receive a larger point value for a new volunteer compared to those with larger populations (For each new volunteer, Wyoming will receive 1.72 points based on its population of 581,311 residents, whereas California, which will receive a much lower number of points per new volunteer, 0.03 with its population of 39,029,342 residents). These point values are based on "new stations per million residents," which is derived from the 2026 estimated population information (https://www.census.gov)
|