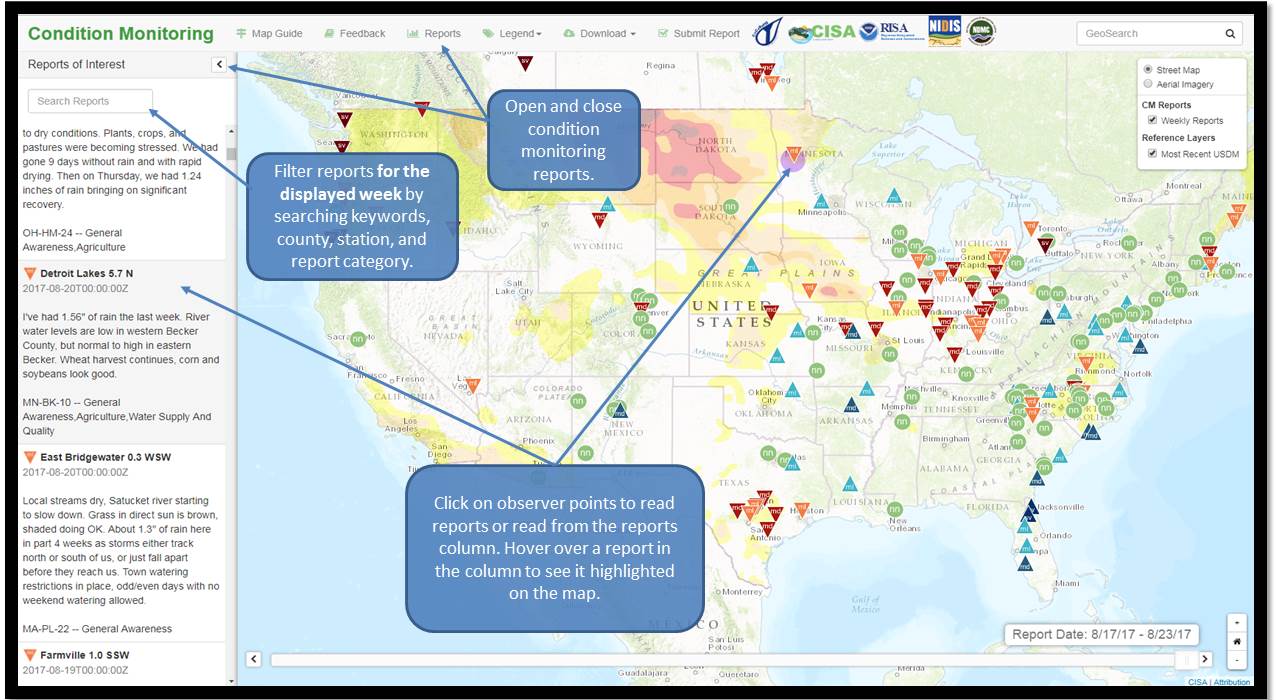
The web map is a tool intended to depict local, community-level conditions and how recent weather and climate events have affected those communities. Volunteer observers provide weekly reports through the Community Collaborative Rain, Hail, and Snow (CoCoRaHS) network website. The web map spatially displays the reports and provides the current US Drought Monitor Map that can be used in the monitoring of drought onset, intensification, and recovery.

Click the image to learn more

CoCoRaHS Data

The condition monitoring web map is designed to work primarily with CoCoRaHS condition monitoring data. This data includes qualitative descriptions of local conditions reported by observers, "Condition Monitoring Reports". Click the observer point location in the web map to read the condition report in a pop up. Filter reports by searching keywords, counties, station number, and report category in the left "Reports of Interest" box. Only the reports currently displayed on the map can be searched.

Time Slider

The slider at the bottom of the map can be used to view reports and the US Drought Monitor Map on a weekly basis. When you open the web map, the last 7 days of reports will be displayed. Use the time slider at the bottom of the page to view reports from previous weeks. Weeks start Tuesday and end Monday. CoCoRaHS volunteers are asked to submit their reports Saturday, Sunday, and Monday so that they can be considered for the US Drought Monitor on Tuesday.

Click the image to learn more

Map Controls

There are numerous ways to interact with the map. The side bar allows users to toggle map layers on and off and the zoom buttons at the side of the map enable users to see a more specific area of the map. The top of the map provides options to give feedback, view legends explaining the map symbols, and submit your own condition monitoring report.All of the report data can be downloaded as a .csv file and queried using computer software such as Microsoft Excel. Alternatively, the CoCoRaHS data website has a query box for searching reports by station, location, category, and date. More download options are currently under construction.

U.S. Drought Monitor

The National Drought Mitigation Center (NDMC) publishes a weekly report of US drought conditions through the U.S. Drought Monitor (USDM). It is jointly produced by NDMC at the University of Nebraska-Lincoln, the US Department of Agriculture, and the National Oceanic and Atmospheric Administration (NOAA). The USDM map is available as a layer in the web map, allowing a comparison of condition monitoring reports with USDM drought designations. Use the time slider to sort through weekly time intervals.

Click the image to learn more

Become a CoCoRaHS Condition Monitoring Observer

Who can participate... Anyone with a desire to learn more about how weather can impact our lives and an enthusiasm for watching and reporting weather conditions can join. Consistent reporting will contribute to a more complete understanding of the weather and climate. Additionally, observers will get the chance to participate in an enthusiastic network of like-minded citizen scientists. Click here to learn more about CoCoRaHS condition monitoring.

CoCoRaHS

  • Community Collaborative Rain, Hail & Snow Network

NDMC

  • National Drought Mitigation Center

NIDIS

  • National Integrated Drought Information System

CISA

  • Carolinas Integrated Sciences & Assessments

RISA

  • Regional Integrated Sciences & Assessments